


Top 3 Key Facts
- Every company has some kind of “sales pipeline management”, but very few use it to manage initiatives in their markets and to carry out planning and forecasting processes.
- Setting up a common and global sales dashboard is not an IT task, but a management task, since we need to align processes and set up regular meetings to ensure data quality.
- Unawareness of your own development across the various markets is very dangerous due to many factors and changes in the markets.
Use case explanation
The managing director is responsible for the development of the business unit. Many managing directors in our network operate according to this principle: “It is better to have a clear view of the situation, regardless of it currently being good or bad, instead of having a positive mood based purely on prose and hope.”
With a clear view of sales, the development of the various markets and the applications, he/she is able to synchronize sales with production and the supply-chain. Additionally, this enables the synchronization of liquidity planning with the financial head. Many managing directors we know are very market-oriented and have a strong intrinsic interest in market trends, market developments and their customer relations. The market intelligence dashboard provides them the security and satisfaction of always being able to see what is going on in the markets.
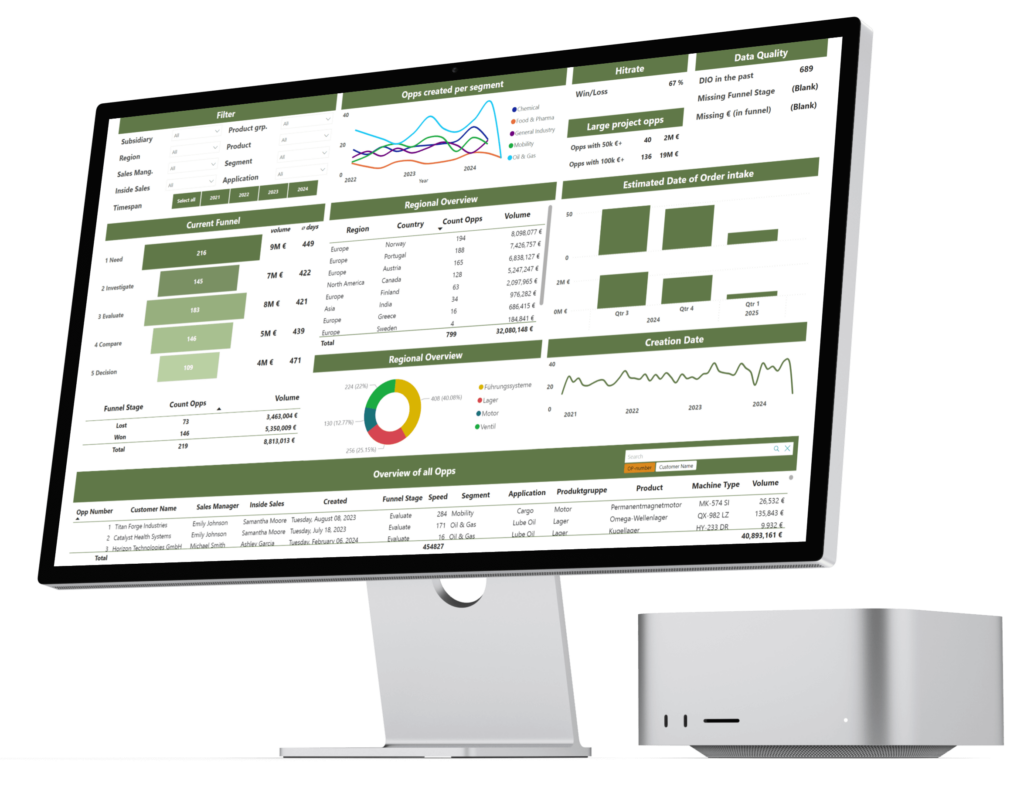
The most important KPI’s are:
(Everything should be filterable by markets, applications / product types and level of abstraction e.g. BU / region / team / individual sales manager)
- Current open opportunities / unique proposals
- Newly created opportunities / unique proposals per month
- Newly created opportunities / unique proposals by source (agent, aftersales, event, inbound, outbound, follow-up project)
- Sales forecast of the next quarters (based on the expected decision date of the opportunity / unique proposal)
- Hitrate of the last 6 months (Won / [Won + Cancelled + Lost])
- Cycle time (average time from “created” to “won”) for the opportunities we’ve won in the last 6 months
Why so important
In 2024 in particular, great uncertainty about further developments of business in the various markets is tangable.
The effects of various events (geopolitics, trade policies such as tariffs and one-sided subsidies) and trends (generational shifts among customers, digitalization, AI, circular economy, etc.) are combining to disrupt the usual market ups and downs.
A clear view based on reliable data can therefore be crucial in order to plan reliably and to gain a competitive edge. A clear view also helps in terms of communication with the management board, supervisory board and owners, who generally need facts.
Benefits
Benefits for the managing director:
- Peace of mind for the managing director
- Syncronization of the sales forecast with operations (production and supply-chain)
- Syncronization of the sales forecast with liquidity planning
- Foundation for discussions with the sales director about “In which market and in what application do we have to become more proactive?”
- Foundation for discussions and exchanges with international general managers about market strategy and contribution of the business unit HQ
- Real-time data due to automated refreshing / updating processes
Additional benefits:
- Quick identification for whom (sales manager) individual support is needed
- Establishing a “fail fast” mindset in the organization that increased the time efficiency of the entire sales organization
- Identifying and monitoring important / strategic opportunities (e.g. new products, new applications, etc.)
Conundrum
What makes this use case so difficult and challenging? “How do we create a reliable and standardized data structure in sales across the various sales teams and regions?”
Action steps
- Define a common sales process with international regions within the business unit
- Define a common sales KPI set with international sales teams
- Create one sales dashboard in a BI system (or CRM if just one CRM system is being used world-wide – if the production and supply-chain is supposed to use the sales funnel to forecast as well, it’s easier to work with a BI system due to high costs of additional CRM licenses)
- Bring data together in BI system
- Set up a regular meeting with sales leaders to ensure data quality and to discuss the data for the benefit of the customers and the entire business unit
Our take-aways
- Create just one dashboard: We often find that instead of a dashboard, a large number of reports are created (several systems and Excel). We have learned that a dashboard (even if it is more complex at the beginning) is more helpful than many reports that are constantly changing. Thanks to the clear structure of the dashboard, everyone gets used to the idea of steering and speaks the same language.
- Invitation of the international sales teams: Without the help of the international sales teams in China, India, US, etc., the data quality will not be reliable. It is therefore important to emphasize the advantages of a common database (global production and supply-chain planning, basis for common product and innovation strategy, etc.). This enables not only the steering of the company by the managing director, but also increases the collaboration between subsidiaries, cultures and language barriers due to a shared understanding of the market, KPIs and activities in the market by the other subsidiaries.
